• Opening hours 9AM - 5PM
  • Address: 1569 Sloat Boulevard, Suite 300, San Francisco, CA 94132

real estate trends

Housing Crisis Ends in San Luis Obispo County

It is very difficult to be quick to call the beginning or the end of any type of major economic cycle while it is happening. But it is pretty easy to call it when it is over. This 10 year report by CoreLogic shows the depth of the housing crisis in one of our central coast zip codes, 93420.

Distressed Property for 93420As you can see, the slope of the housing tragedy for too many homeowners has largely dissipated at the same pace. It is interesting to note that the Auction rates, REO rates, and short sale rates were pretty steady though out the entire cycle. A short sale is when the homeowner and the bank agree to sell the property for a price below the loan value. REO and Auctions are mostly a result of a bank foreclosing on a property or a homeowner’s strategic default.

For most homeowners who have stayed in their property through the crisis, the value of homes have returned to 2006 prices. Indeed, today’s home market sees home prices continuing to rise as a result of demand outpacing supply. There has been very little new home building in our county but our population continues to grow. This market is also influenced by the global demand for California property. The central coast offers the most value and highest quality lifestyle in the state (or as many magazines suggest, the best place to live in the nation!).

Be sure to check out the community pages to find out what is happening in the housing market where you live.

Great Time to Buy 4000 to 5000 sq ft

Sometimes strange economics apply to home pricing. For a variety of reasons, home buyers may find better value in a market at certain price points. In 2014, home values for properties have gone up significantly per square foot when the property iis between 2000 and 2500 square feet. Properties that are in the 2500 to 3000 square foot size have remained pretty steady in pricing over the past year.

Homes in the 3000 to 4000 square foot range saw a seasonal dip in the first quarter of 2014, but rebounded sharply in the second quarter of the year. At the higher end of the pricing spectrum, home prices for 4000 to 5000 square foot homes have actually declined in pricing over the past year – making that segment an excellent value.

Luxury homes over 5000 square feet have remained quite constant. These properties tend to include significant mitigating features like spectacular views or acreage that play a role in stabilizing home values.

Below is a chart that illustrates these trends. Click the graph to enlarge the view

Arroyo_Grande_Real_Estate_-_CENTURY_21_Hometown_CENTURY_21_Hometown

Where do Central Coast Home Buyers Come From

Buyers Shopping for Central Coast Real EstateCentury 21 Hometown has more consumer website traffic (over 600,000 monthly visits) than any other brokerage or franchise website on the Central Coast according to Hitwise. Only Century 21 Hometown partners Realtor.com, Zillow.com, and Trulia.com have more. No other brokerage ranks in the top 10 for the Central Coast DMA, Hitwise reports. The Central Coast DMA or Demographic Market Area is defined as the stretch of the California coastline that includes Ventura County, Santa Barbara County, and San Luis Obsipo County. The image to the left explains where consumers are connected to the internet when they access C21Home.com for property information. Our ability to attract buyers from beyond the local market area is a key reason why sellers choose to list their home with a Century 21 Hometown agent.

As you might imagine, most buyers for real estate on the Central Coast are local. San Luis Obispo and Arroyo Grande, two of the region’s largest cities account for the most significant amount of consumer traffic. Where it gets interesting is looking at the other cities in the top 10. They include, in order of traffic volume: Bakersfield, Los Angles, Santa Maria, Paso Robles, San Francisco, Atascadero, Paso Robles, and Orcutt.

“I am not surprised at all by these results,” says Century 21 Hometown Realty broker Amy Gallagher. “I review every transaction for the company and I routinely see the buyers coming in from the Central Valley, Bay Area, and Los Angles.” Central Coast is known by many to provide one of the best lifestyles in America and real estate here trades at a discount to property closer to the major metropolitan cities.

The Future Looks Bright

The county planning commissions in Ventura, Santa Barbara, and San Luis Obsipo Counties have taken care to manage growth. Every planned development project goes through a careful consideration process to ensure that expansion does not overwhelm community roads, school, or other population sensitive services. We have a condition whereby far more people are trying to move to the Central Coast than move away. This holds property prices stable and drives property value growth.  If you would like to see our recent Central Coast Market Trends, here is a sample for the CCRMLS market area for Northern Santa Barbara County and San Luis Obispo County.

Central Coast Market Trends


Free Credit Scores Abound

As a home buyer, a mortgage may play an important role in your purchase. It is a good idea to check your credit history before starting the home buying process. You will want credit hygiene to enhance your opportunity to negotiate the best possible mortgage program.  A handful of credit card issuers are betting that you’d like to see your credit score every month. Discover, Barclaycard US and First Bankcard’s have started offering their 35 million cardholders free access to their credit scores.

The score they’re sharing ? called FICO ? is used by credit card issuers to decide whether to give you a charge account and what interest rate to charge you.

Discover is putting your credit score on your monthly statement. Barclaycard and First Bankcard customers will have to visit their credit card company’s website to see their score.

You don’t have to open a new credit card account to see your credit score. Credit.comCreditSesame.com and CreditKarma.com will give you a credit score (without making you pay for credit monitoring services as some other sites do).

The score you get on those sites can be different from your FICO score and from the credit scores used by mortgage companies, auto dealers and other types of lenders.

All credit scores are calculated using information from your credit report, but each type of credit score is based on a proprietary formula devised by the company that sells the score. While different scores have different number ranges they all predict how likely you are to repay.

So if you have good credit based on one scale, you should have good credit based on another credit score’s scale, even though the two numbers might be different.


Central Coast Real Estate Market Trends

The Central Coast Real Estate Market is in great shape, with one problem. Our inventory counts are down dramatically. Over the last 5 years, we have averaged an inventory of 3400 homes for sale at any given time. Now we are in the 1500 range. Mouse over the lines on the map below to see the changes in listing inventory over the past 5 years.

What this really means to you is that between now and next year, prices will continue to rise as a result of fewer listings. Common wisdom would lead you to believe that the reason why people are not selling is because they do not have equity in their home. Nothing could be further than the truth. Only 14% of homeowners in the CCRMLS region currently show negative equity. The number of distressed properties county wide has dipped below 100 according to information from CoreLogic. A distressed property is either bank owned, in the process of foreclosure, or has been sent a notice of default. These are really low numbers.


Take a look at the effect of low inventory has on the market. We have continued to sell just under 600 homes a year, but you see a significant spike in 2013 corresponding to the drop in inventory. Take a look at the inflection point in March where inventory dropped down into the eleven hundreds and the price spiked up nearly 80% the corresponding month.

If you want to see pricing trends in your town, contact a Century 21 Hometown Agent or visit your Hometown real estate page at the bottom of the home page at Http://c21home.com


San Luis Obispo housing equity turned the corner

There are a number of forward looking indexes that try to predict the future of real estate values. They all fail. The only way to have certanty about the housing market is to look backwards, which is exactly what we have done.

Every economist has been trying to call the bottom of the market – or that point at which the foreclosure debachle that put pressure on housing prices changed from getting worse to getting better. We now have the answer. It was in September 2011. You may not know this, but every foreclosure in s amatter of public record. Banks file the foreclosure notices with local government. CoreLogic is a company that collects that data from local government and leverages it to track market activity. They also use that data to provide something called an AVM, or Automated Value Model. This AVM is the tool that banks use to monitor the debt to value ratio on all current loans and on loan approvals. As we all know, home prices are largely dictated on the loan value of the mortgage. It does not matter how much a consumer wants to pay for a home, it only matters if the bank will lend against the selling price.

Below are two charts. The first shows negative equity in the San Luis Obispo region. Up until December 2011, about 20% of all homes in the area were distressed. That means that the mortgage amount owed was greater than the estimated selling price if the home were sold that day. You may have heard phrases like “1 in 5 homes are underwater.” As of June 2012, the number of homes underwater had dropped by 25%, down into the 16% range. As home prices climb, underwater homes decline. We can tell you that home prices went up month over month throughout the summer and fall. Century 21 Hometown Realty was selling around 300 homes per month, and homes on the market for any length of time saw price increases rather than price cuts. Buyer demand for housing is strong and we are getting multiple offers on listings for the first time in many years.

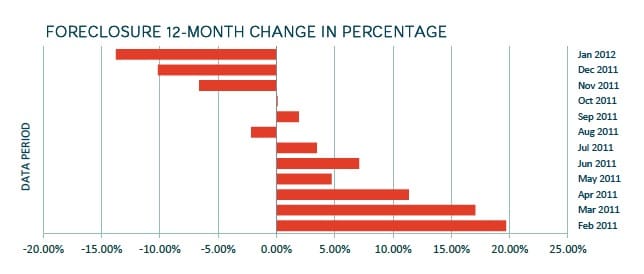
The second chart below shows the reversal in foreclosures. From October 2011 forward, the number of foreclosure properties have gone down each month. This correlates to the negative equity chart.

reversal of negative equity and foreclosure trends
Click Image to enlarge

Rent Vs. Buy

Americans’ Expectations Align to Encourage Home Buying

rent vs buyMore consumers may be looking to purchase homes with a shift in several key housing market indicators, according to Fannie Mae’s March 2012 consumer attitudinal National Housing Survey. More Americans now expect both home rental and home purchase prices to increase over the next year.


  • Nearly half of consumers expect higher rental prices, the highest number recorded since monthly tracking began in June 2010.
  • Thirty-three percent expect home prices to increase, up 5 percentage points since last month, and the highest percentage recorded in over a year.

In addition, confidence in consumers’ views of their own finances is stabilizing—for three straight months—44 percent believe their personal finances will get better over the next year. These trends may be providing Americans with an increased sense of urgency to buy a home as 73 percent of Americans now believe it is a good time to buy a home, up from seventy percent in February.

“Conditions are coming together to encourage people to want to buy homes,” says Doug Duncan, vice president and chief economist of Fannie Mae. “Americans’ rental price expectations for the next year continue to rise, reaching their record high level for our survey this month. With an increasing share of consumers expecting higher mortgage rates and home prices over the next 12 months, some may feel that renting is becoming more costly and that homeownership is a more compelling housing choice.
Homeownership and Renting
Thirty-three percent of respondents expect home prices to increase over the next 12 months, a five percentage point increase from last month, the highest level over the past 12 months.

The survey shows that on average, Americans expect home prices to increase by 0.9 percent over the next 12 months (up slightly since last month).

Additionally, 39 percent of Americans say that mortgage rates will go up in the next 12 months, a five percentage point increase from last month.

The percentage of respondents who say it is a good time to buy rose by three points to 73 percent, the highest level in over a year, while the percentage of respondents who say it is a good time to sell rose one point to 14 percent this month.

On average, respondents expect home rental prices to increase by 4.1 percent over the next 12 months, a significant increase since February, and the highest number recorded to date.

Forty-eight percent of respondents think that home rental prices will go up, a three percentage point increase from last month and the highest number recorded to date.

Sixty-six percent of respondents say they would buy their next home if they were going to move, up one point since last month, while thirty percent say they would rent, up one point versus last month.

The Economy and Household Finances
The rise in confidence in the economy’s direction leveled this month, with 35 percent responding that they think the economy is on the right track, consistent with February’s total. The percentage who say the economy is on the wrong track rose slightly from 57 percent to 58 percent.

Only 12 percent think that their personal financial situation will worsen in the next 12 months, consistent with February as the lowest value in over a year, and tied with January 2011 for the lowest to date.

Twenty-one percent of respondents say their income is significantly higher than it was 12 months ago, up 1 point versus February, while 63 percent say it has stayed the same – consistent with February’s values

Thirty-four percent say their expenses have increased significantly over the past 12 months (a slight increase of one percentage point).

Foreclosure rates drop nearly 15% in San Luis Obsipo County

Here is another great sign of economic stability and home ownership stability in San Luis Obispo County. According to CoreLogic, The Foreclosure 12 – Month Percentage shows the percentage change in home foreclosures in San Luis Obispo County. CoreLogic records this data from banks and public record sources.

Foreclosure Rate in Decline for San Luis Obispo County
Data from CoreLogic


Century 21 Hometown Realty has been working with consumers on short sales and with banks to liquidate foreclosed properties for the past 5 years. It is with a deep sigh of relief that we see stability returning to the marketplace. With every foreclosure is a family that is being asked to move – something that breaks our hearts and the hearts of our community.

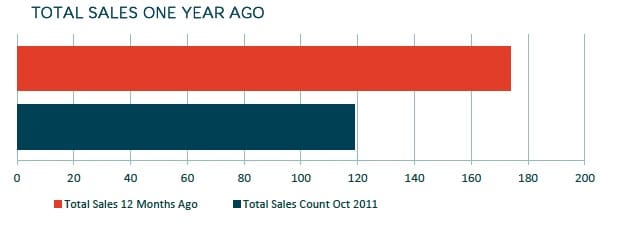
There are many economists that are theorizing what caused the turn around in housing, but in reality – it is likely a combination of many factors: low interest rates; changes in lending standards; population expansion, government policy, and so on. For us here on the central coast, we see inventory as the driving factor. As you can see from this next graph, there have been fewer sales.


Corelogic Sales Reporting


Century 21 Hometown Realty is actively seeking listings to fulfill our buyer requests. If you are thinking of listing your home for sale, please contact one of our agents immediately. To learn more about our programs for sellers, please check out this information.

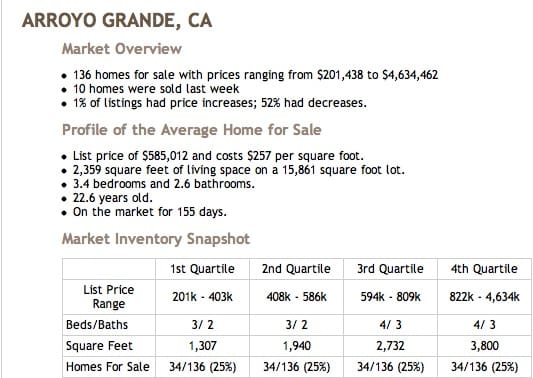
Here is a quick snapshot of real estate trends in a town like Arroyo Grande. If you would like these trends for your area, contact any of our offices or agents today.

Arroyo Grande Market Data
Arroyo Grande Public Record data from CoreLogic ePropertyWatch

Who is tracking you online – home safety update

Property Search PrivacyEver visit a website looking for something, for example houses? Then every other time you searched for something else, Zillow, REALTOR.com, Trulia or some other real estate brokerage website shows up first in your search rankings! Some say “pretty cool… how’d they do that”. More and more are saying “OK, that’s enough”. Enter the growing area called Online Behavioral Advertising.

Many of the ads you receive on Web pages and on web searches are, believe it or not, customized just for your eyes only. Ads you see will be based on predictions about your interests generated from your visits over time and across different Web sites.

This type of ad customization – sometimes called online behavioral or interest based advertising. It works through a system of files on your computer called “cookies”. Like crumbs used to document “where you have been” these cookies tell websites a lot about where you have visited, what you have searched on and what you are clicking on. Then, this pattern of interest gets documented and entered into a profile created just on your viewing habits. They may not know your name (at this point) or street address but they know your city and what interests you. This data is them merged into other data collected such as DMV auto registrations and other data. Then when they can collect an actual name, the systems can then add street addresses and other personal data.

This website uses session based tracking cookies that enhance your property search experience, but we do not harvest behavioral or tracking information from your computer like many other property search websites. The only way we retain any information about you is if you create an account. If you look at our privacy policy, you will see that we retain the information but keep it safe and confidential.

On many other real estate websites, Big Brother Is Watching! Recently the Federal Trade Commission dug deep into these data warehouses to make sure no privacy issues are being raised. Well they found a lot. There is an entire internet industry based on profiling and segmentation.

Giving consumers an option of “do not track me” has been a hot topic of discussion in Washington. The White House and the Federal Trade Commission claim they want to work with the advertising industry on a voluntary basis to make it easier for consumers to opt-in or out data collection for advertising purposes. Just the fear of regulation prompted some of the internet’s biggest players to agree to “talk” about their policies.

Yahoo, just this past week, said they would have a simple button consumers can click if they want a Tracking-Free experience.

With the White House’s involvement ratcheting up the issues, it has theoretically forced Google, Yahoo, Microsoft, and AOL to stop monitoring the Web-surfing habits of users who click a “Do Not Track” button on their browsers.

So if you care to, go to http://www.aboutads.info/choices and let the system do its magic then you can OPT OUT of tracking from the data collectors, make a complaint or learn more about the policies.


Paso Robles Home Showing Report

Foot traffic to properties for sale can provide great insight into the direction of future home sales. SentriLock is the lock box provider to the regions real estate professionals. Today’s lock boxes are smart. They record information each time the lockbox is accessed, and record who access the box. Aside from the enhaned security features, knowing the number of showings is indicative of real estate buyer activity.  SentriLock, LLC. provides showing data to the National Association of REALTTORS Research with monthly data on the number of showings.

Foot traffic in the area covered by the Paso Robles Board of REALTORS® (CA) declined by 13% in February of this year relative to the same month last year. This was the 4th consecutive year-over-year decline.

However, foot traffic from a year earlier was atypically strong, while current levels remain robust relative to the strong, tax-induced levels from the spring of 2010.

paso robles real estate showings report
Click Image to enlarge

Housing inventory in decline

Everyone knows the old supply and demand curve. As demand goes up and supply goes down and prices usually increase. Clearly there are numerous factors that have influence over this rather simple economic model. All things considered, when you have more buyers than sellers, prices rise.

If you look at supply curve of real estate inventory over the past decade, you quickly notice that the supply curve went way up for the past 6 years. The climb began in 2004 and peeked in the middle 2006. From there, the supply curve to real estate for sale has had an erratic, but slow downturn. This supply curve would indicate that inventory levels in real estate have returned to normal. This is a great indicator of health in the housing market.

There are reports that banks are holding a lot of foreclosure inventory off the market. By holding back inventory, they stabilize supply curve of the housing market and preserve home values. This bank owned inventory is called Shadow inventory.

In any case, the good news for home sellers is that low inventory puts upward pressure on home values. This is also a clear signal to potential buyers – buy now or pay more later.

en_USEnglish